Chapter 13 Introducing Flexdashboard
Flexdashboard provides a systematic framework for creating dashboards using R and RMarkdown. With Flexdashboard, you can design dashboards without needing a full-fledged web application or web server, making it perfect for analysts and data scientists familiar with R. In this chapter, we’ll walk through an introduction to Flexdashboard, creating a static dashboard, and then move on to discussing different layouts and storyboards.
13.1 What is Flexdashboard?
According to the official RStudio documentation, Flexdashboard is an R package that allows you to easily create flexible, attractive, and interactive dashboards. One of the key strengths of Flexdashboard is that it integrates with RMarkdown, enabling analysts to compose informative dashboards using narrative, data, R code, and interactive widgets. The resulting dashboard can be rendered into HTML, and can be made fully interactive with Shiny.
Features of Flexdashboard include:
- Storyboard layouts which allow you to present series of visualizations and related comments.
- Customizable layout options to arrange visual components.
- Compatibility with numerous R packages, facilitating easy integration of tables, graphics, and more.
13.2 Install Flexdashboard
To get started with flexdashboard, you’ll first need to install it. If you’re using the pacman package, which offers a convenient mechanism for managing and installing R packages, you can install flexdashboard as follows:
The above code first checks if pacman is installed and installs it if it isn’t. Then, it loads the flexdashboard package using p_load, which will also install it if it hasn’t been installed previously.
13.3 Creating a Static Dashboard
Flexdashboard provides a powerful interface to create dashboards directly from R Markdown. Here’s a guide to help you get started with a simple static dashboard using the mtcars dataset.
1. Initialize a New R Markdown File
In RStudio, initiate the creation of a new R Markdown document by navigating to ‘File’ > ‘New File’ > ‘R Markdown…’ This will present you with a dialog box.

From this dialog box, select ‘From Template’ and then choose ‘Flex Dashboard’ from the available templates. This action will open a new .Rmd file pre-filled with example content.

2. Replace Example Content
The new .Rmd file will have placeholder content. Replace this content with the following basic example using the mtcars dataset:
---
title: "Sample mtcars Dashboards"
output:
flexdashboard::flex_dashboard:
orientation: columns
vertical_layout: fill
---
```{r setup, include=FALSE}
library(flexdashboard)
```
Column {data-width=650}
-----------------------------------------------------------------------
### Chart A
```{r}
```
Column {data-width=350}
-----------------------------------------------------------------------
### Chart B
```{r}
```
### Chart C
```{r}
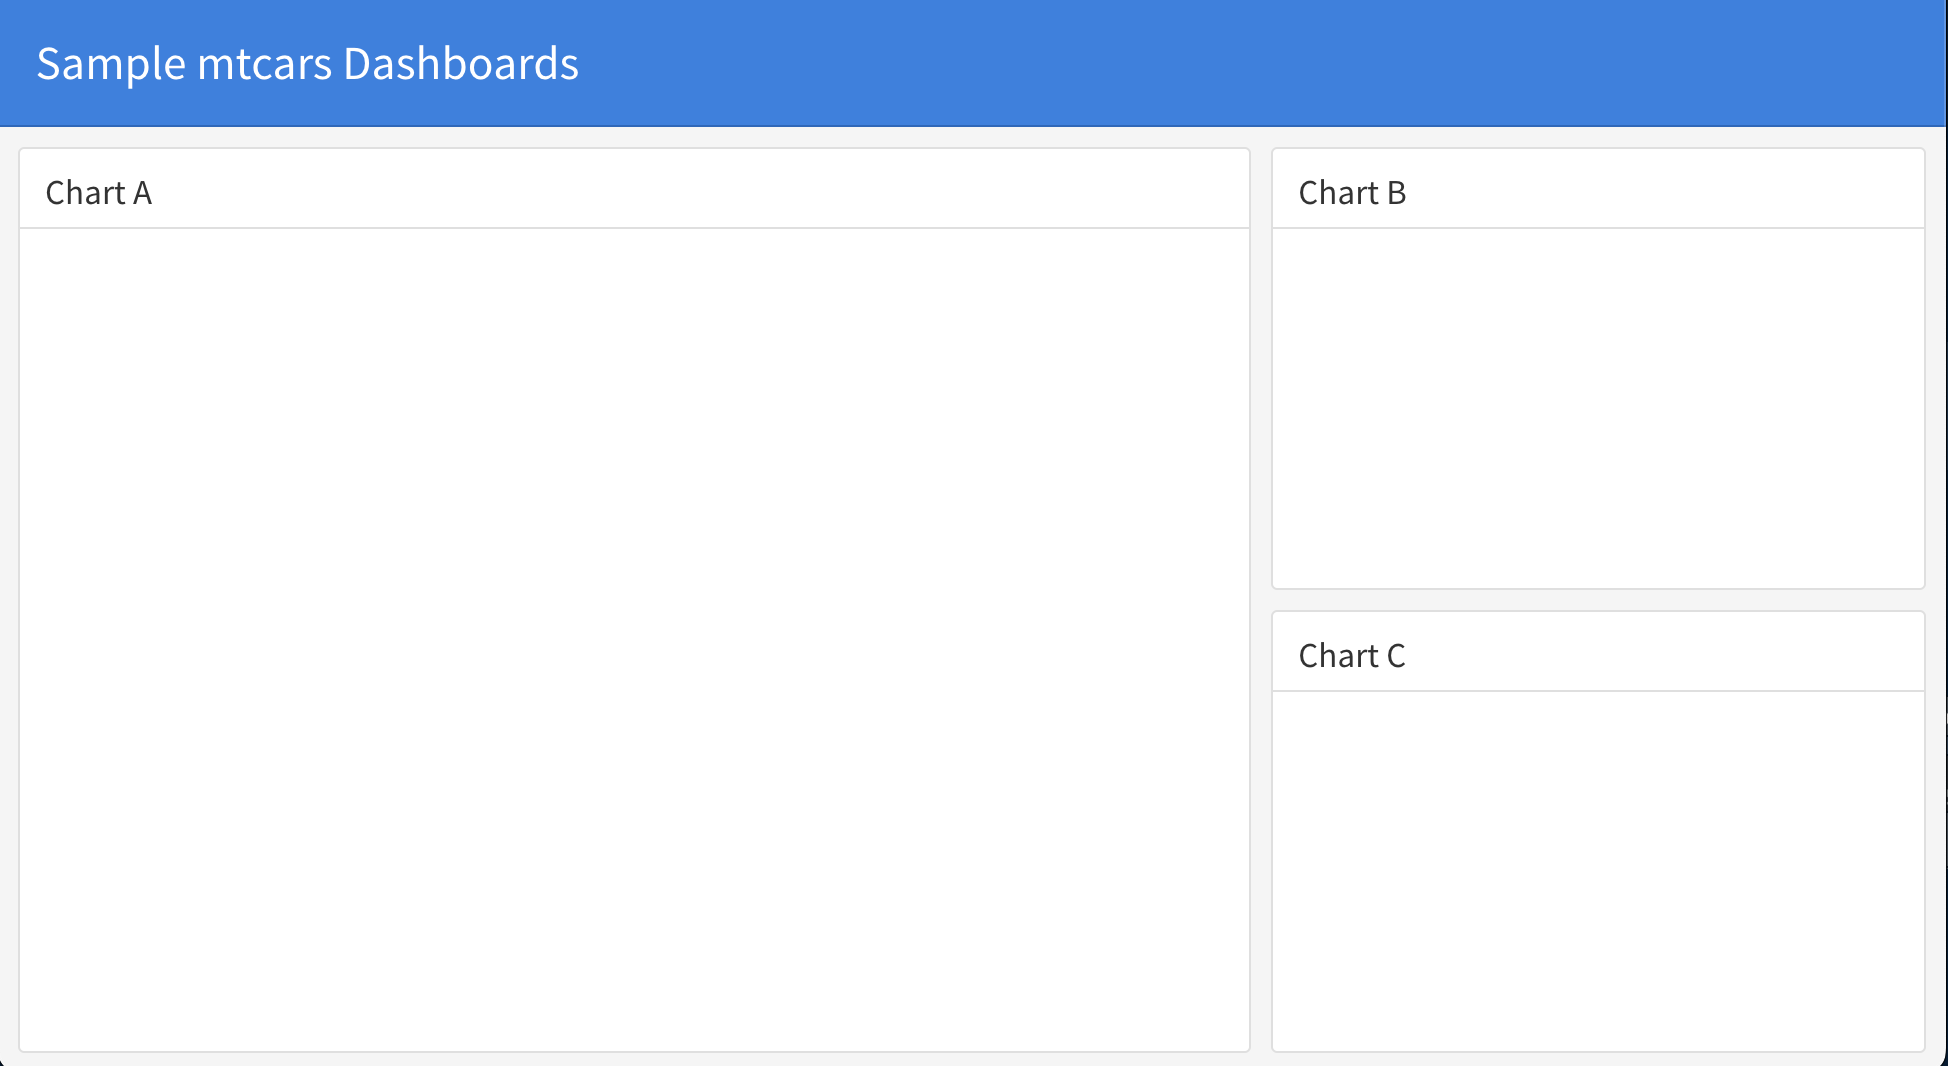
```The document begins with the Front Matter, also known as the YAML Header, which remains unchanged from your initial input. This header primarily defines the dashboard’s title and its layout settings. Following the header is the Setup Section, where I have labeled the code chunk that imports the flexdashboard library as “Setup”. The layout of the document then transitions into columns. The first column is identified with the header “First Column” and has been assigned a width attribute of 650 pixels. Within this column, there is a designated subsection for “Chart A”, accompanied by its respective R code chunk. In a similar fashion, the second column, labeled “Second Column”, is defined with a width of 350 pixels. This column comprises two subsections: one for “Chart B” and another for “Chart C”, and both of these subsections have their individual R code chunks. Here is what this output will look like when knit:
Using the mtcars Dataset: At the beginning of your R Markdown file, load the necessary libraries and the dataset:
---
title: "Sample mtcars Dashboards"
output:
  flexdashboard::flex_dashboard:
    orientation: columns
    vertical_layout: fill
---

```{r setup, include=FALSE}
pacman::p_load("flexdashboard", "tidyverse", "ggthemes")
data("mtcars")
```
We made several modifications to the document, starting with updating the title. Additionally, we incorporated a few vital packages: “flexdashboard”, “tidyverse”, and “ggthemes”. After these additions, we proceeded to load the “mtcars” dataset. To provide some context on the packages: “flexdashboard” facilitates the creation of interactive dashboards, “tidyverse” is a collection of R packages designed for data science tasks, and “ggthemes” offers extra themes, scales, and geoms for ‘ggplot2’ to enhance the visual appeal of plots.
Add a Chart: Below the headers in the .Rmd file, you can add a chunk to display a plot:
Add a chart in the first column, i.e. chart a as follows:
Column {data-width=650}
-----------------------------------------------------------------------

### Miles per Gallon vs. Number of Cylinders

```{r}
mtcars %>%
  select(mpg,cyl,am) %>%
  mutate(cyl = as.factor(cyl),
         am = as.factor(am),
         am = recode(am,
                     "0" = "Automatic Transmission",
                     "1" = "Manual Transmission")) %>%
  ggplot(aes(x=cyl,y=mpg)) +
  geom_boxplot() +
  facet_wrap(~am) +
  ylab("Miles per Gallon") +
  xlab("Number of Cylinders")
```
In the above RMarkdown fragment, the headding “Chart A” is replaced with the ne chart title and a plot is added. In a simmiluar fations Chart B and C can be change.
Render the Dashboard: Save and click on the ‘Knit’ button. This will generate a static HTML dashboard displaying the chart. Here is the complete RMarkdown file.
---
title: "Sample mtcars Dashboards"
output:
  flexdashboard::flex_dashboard:
    orientation: columns
    vertical_layout: fill
---

```{r setup, include=FALSE}
pacman::p_load("flexdashboard", "tidyverse", "ggthemes")
data("mtcars")
```

Column {data-width=650}
-----------------------------------------------------------------------

### Miles per Gallon vs. Number of Cylinders

```{r}
mtcars %>%
  select(mpg,cyl,am) %>%
  mutate(cyl = as.factor(cyl),
         am = as.factor(am),
         am = recode(am,
                     "0" = "Automatic Transmission",
                     "1" = "Manual Transmission")) %>%
  ggplot(aes(x=cyl,y=mpg)) +
  geom_boxplot() +
  facet_wrap(~am) +
  ylab("Miles per Gallon") +
  xlab("Number of Cylinders")
```

Column {data-width=350}
-----------------------------------------------------------------------

### MPG vs. HP (Auto Trans.)

```{r}
mtcars %>%
  select(mpg,cyl,am,hp) %>%
  filter(am == 0) %>%
  mutate(cyl = as.factor(cyl)) %>%
  ggplot(aes(x=hp,y=mpg,color=cyl)) +
  geom_point() +
  theme(legend.position = "bottom") +
  labs(color = "Number of Cylinders") +
  ylab("Miles per Gallon") +
  xlab("Horsepower")
```

### MPG vs. HP (Manual Trans.)

```{r}
mtcars %>%
  select(mpg,cyl,am,hp) %>%
  filter(am == 1) %>%
  mutate(cyl = as.factor(cyl)) %>%
  ggplot(aes(x=hp,y=mpg,color=cyl)) +
  geom_point() +
  theme(legend.position = "bottom") +
  labs(color = "Number of Cylinders") +
  ylab("Miles per Gallon") +
  xlab("Horsepower")
```
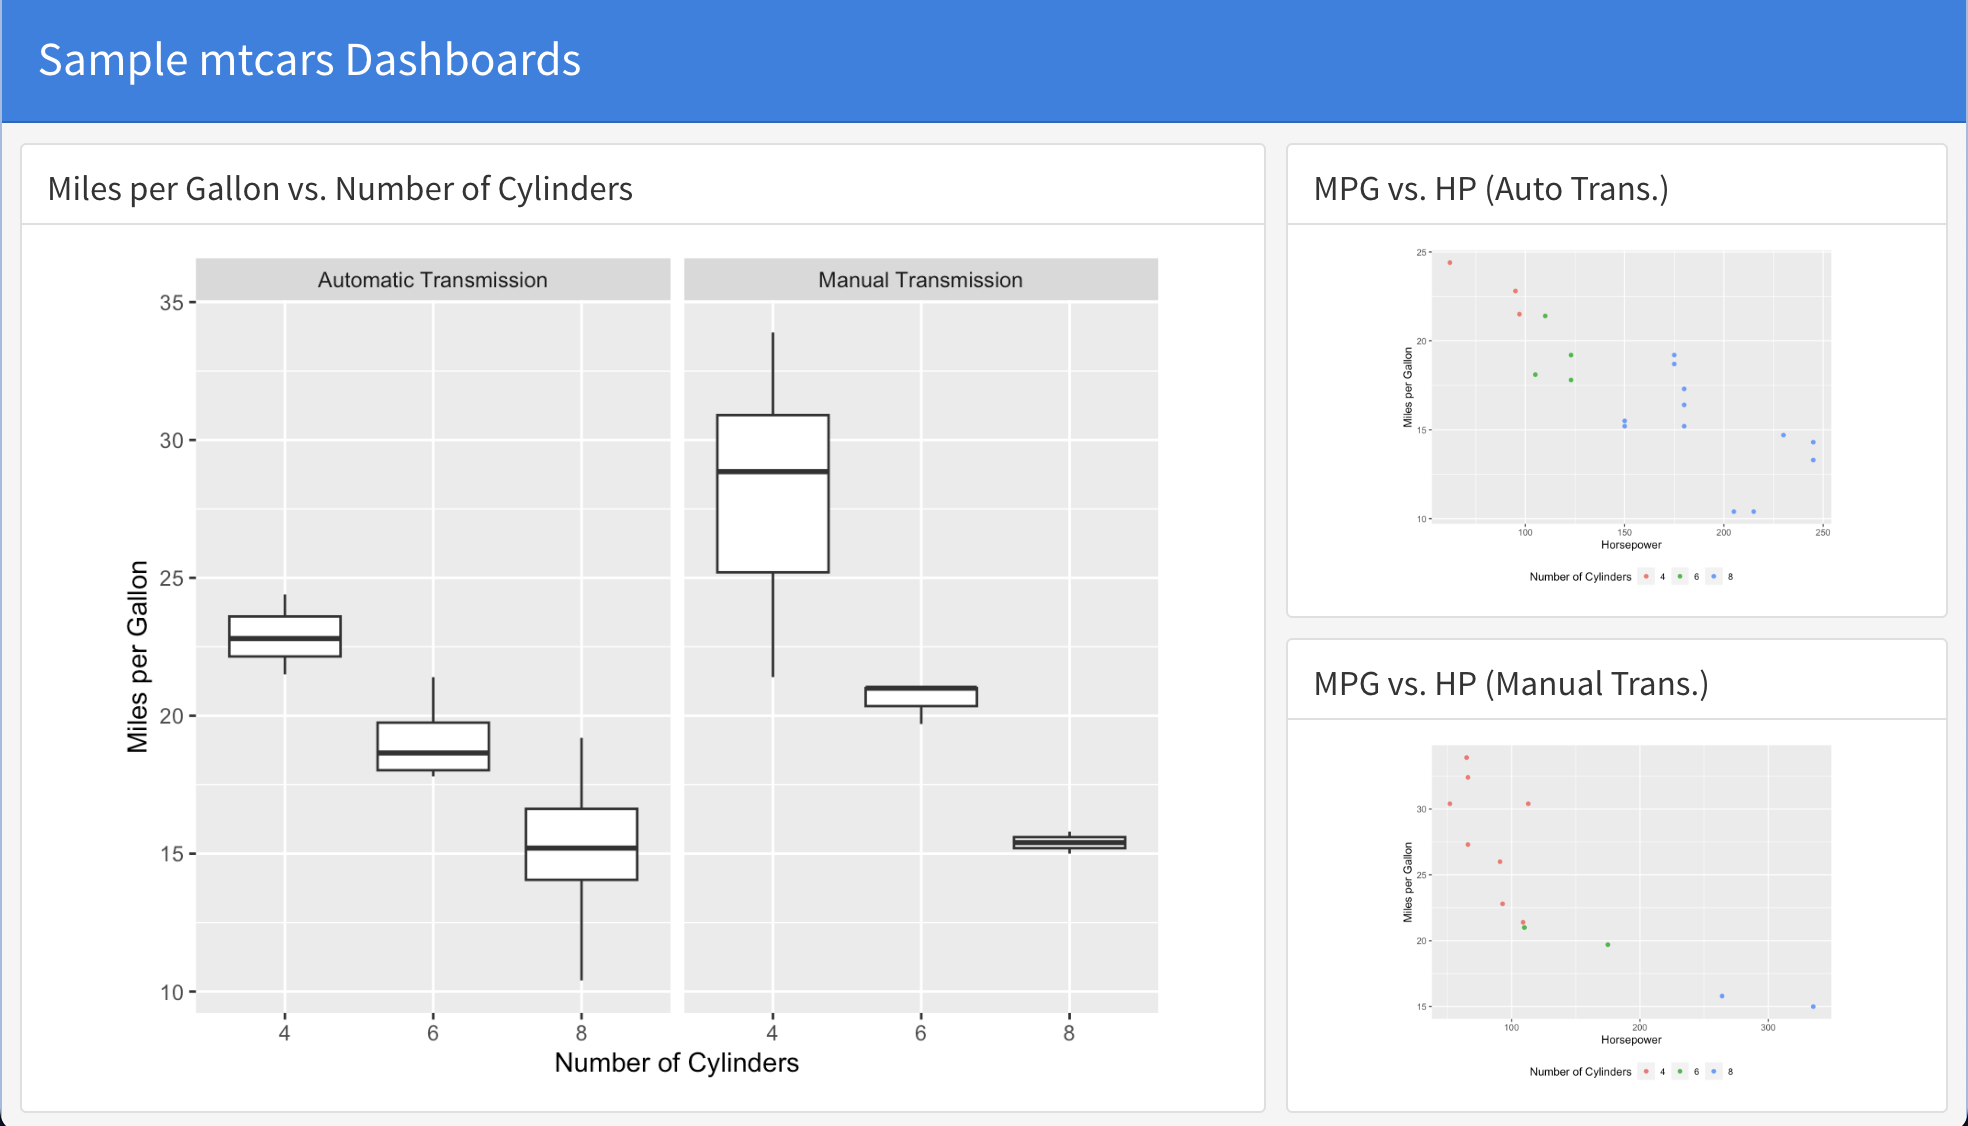
Here is what the rendered dashboard looks like:
13.4 How Layout Changed
Flexdashboard offers various layout options to best present your data. For the mtcars dataset:
Row Orientation: By changing orientation: to rows like so
---
title: "Sample mtcars Dashboards"
output:
  flexdashboard::flex_dashboard:
    orientation: rows
    vertical_layout: fill
---
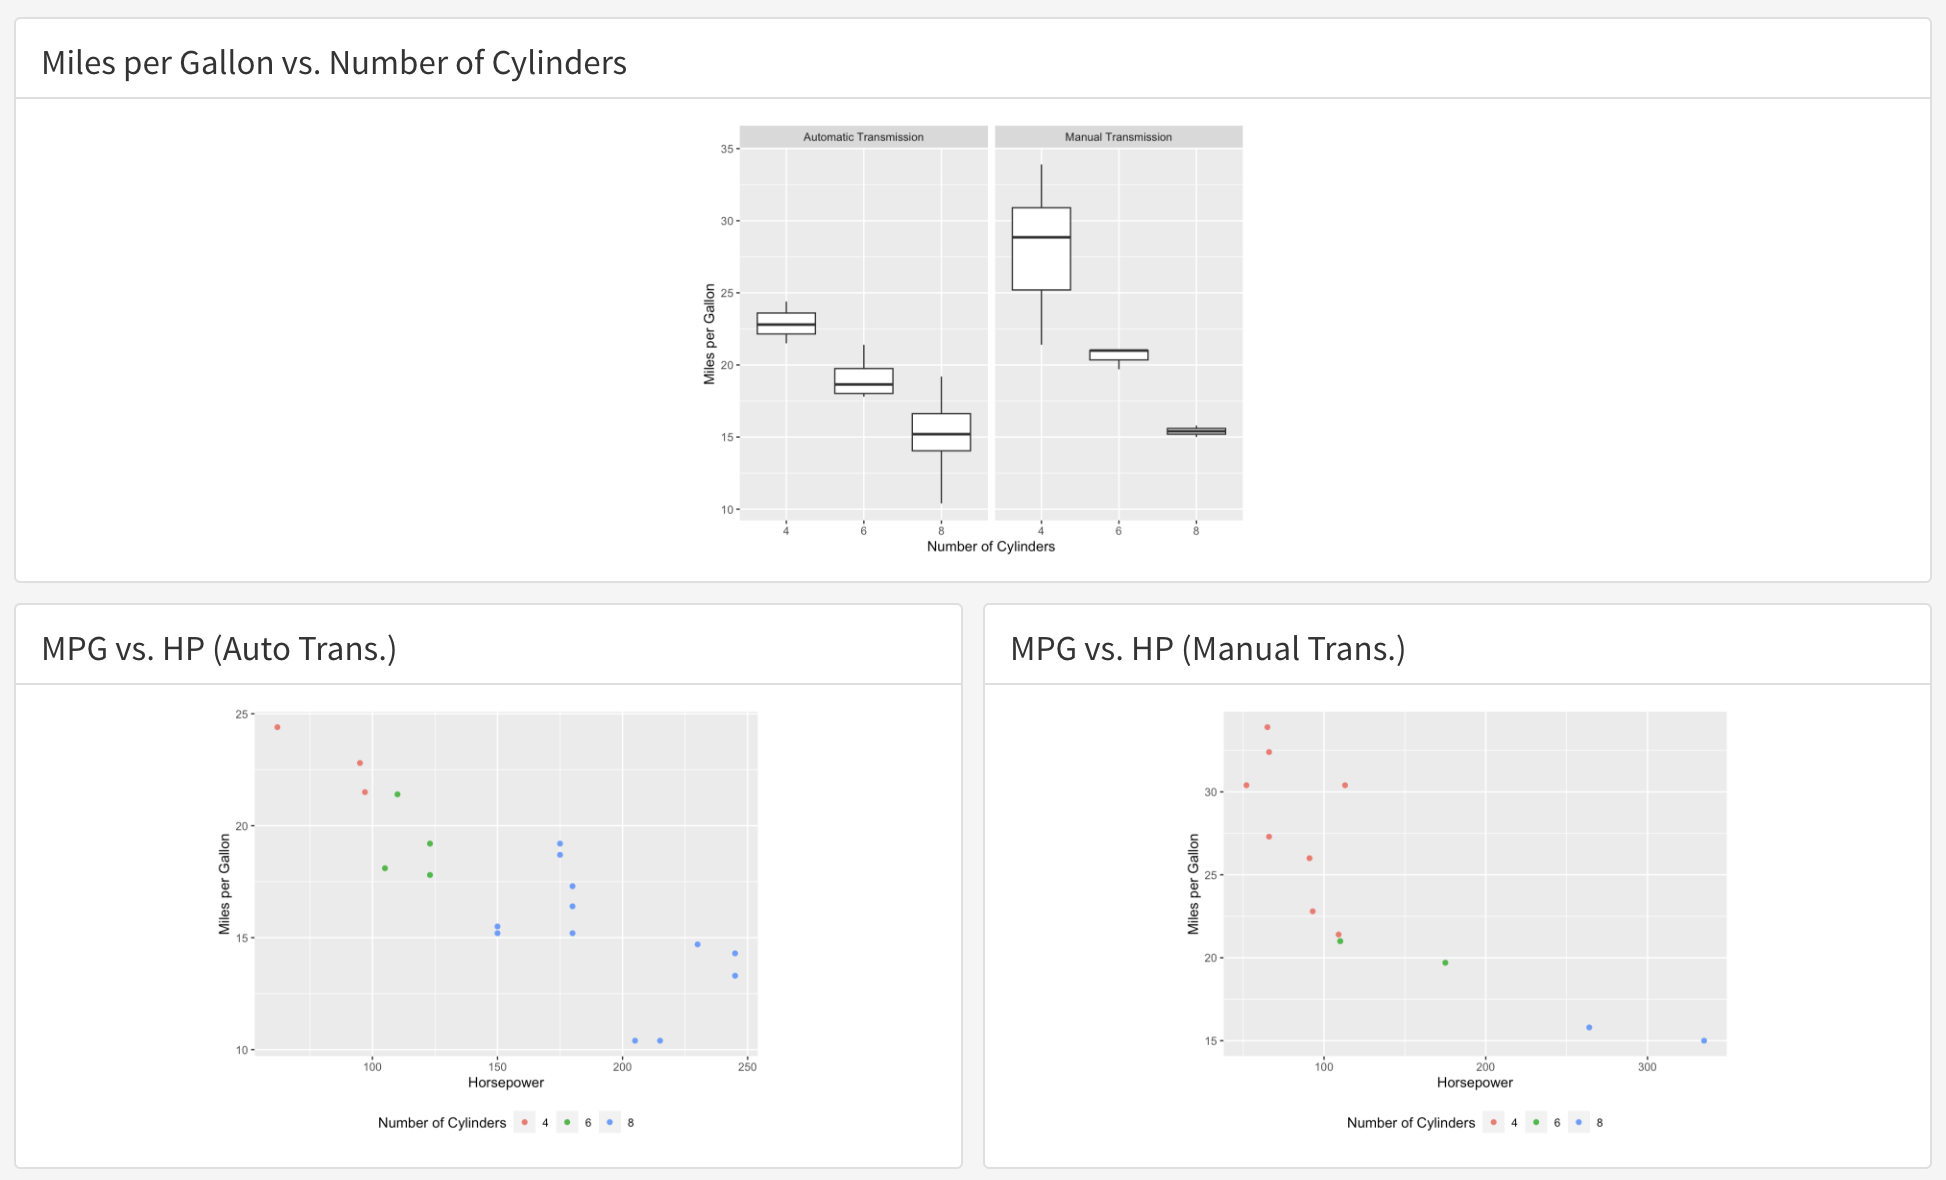
the dashboard will have rows rather than columns.
Add scrolling: By changing vertical_layout: to scrol like so
---
title: "Sample mtcars Dashboards"
output:
  flexdashboard::flex_dashboard:
    orientation: columns
    vertical_layout: scrol
---
You will get a scrolling dashboard.
13.5 How to Use Storyboards
Storyboard layout is perfect for presenting a series of visualizations and related comments. With the mtcars dataset:
Initiate a Storyboard Layout: Add Storyboard in the YAML header.
---
title: "Sample mtcars Dashboards"
output:
  flexdashboard::flex_dashboard:
    storyboard: true
---
Add Frames: Each frame represents a visualization or a related component. Here is an example:
### Frame 1 - Text in story box

Column 1


***

Column 2
- Render: Save and click on ‘Knit’. Your storyboard dashboard will be created with navigation tabs for each frame. Here is the complete sample code that will create a minimal dashboard with a storyboard layout:
---
title: "Storyboard Commentary"
output:
  flexdashboard::flex_dashboard:
    storyboard: true
---

### Frame 1 - Text in story box

Column 1


***

Column 2

### Frame 2 - Text in story box

Column 1


***

Column 2
For more detail on layouts, see https://pkgs.rstudio.com/flexdashboard/articles/layouts.html.
13.6 Basic Dashboard Design
In our exploration of dashboards, we distinguish five main types, each serving a unique purpose and guided by specific design principles.
Strategic Dashboards primarily aim to monitor long-term company strategies. Their focus is on analyzing and benchmarking critical trend-based information. In design, they emphasize a high-level overview to showcase trends. Although details remain essential, these dashboards lean away from excessive granularity in favor of aggregated data and broader trends. It’s crucial for them to be visually rich, leveraging graphs and charts to represent data effectively. Furthermore, maintaining consistent time frames, such as quarterly or annual views, aids in accurate data comparisons.
Operational Dashboards are designed to monitor, measure, and manage day-to-day processes or operations. They need to stay updated in real-time, reflecting the most current data. Any anomalies or immediate concerns should be conspicuously highlighted through clear alerts and indicators. Given the fast-paced nature of the operational domain, these dashboards should be mobile-friendly, enabling users to access vital data on the go. Moreover, every metric displayed should inherently guide an immediate action or response.
Analytical Dashboards, tailored for data analysts. Their design facilitates a deep dive into extensive data sets, extracting insights that inform executive decisions. Features that enhance the user experience include filters, drill-down capabilities, and tools for multi-dimensional analyses. Ensuring data integrity is paramount, and the source of data must be both accurate and reliable. A diverse range of visualization types, from heat maps to scatter plots, should be available to cater to the myriad ways data might be analyzed. These dashboards also benefit from providing historical data, assisting analysts in tracking trends and anomalies over extended periods.
Platform-specific Dashboards cater to niche analytics, such as tracking performance on social media platforms. They emphasize metrics relevant to their specific platform – for instance, a social media dashboard would prioritize metrics like engagement rates. Seamless integration capabilities with the targeted platform are essential, allowing real-time data retrieval. Benchmarking features that enable comparisons against industry or competitor data can provide valuable insights. These dashboards also need to spotlight actionable insights, such as content recommendations for a social media strategist.
Tactical Dashboards cater to mid-management. They support the formulation of growth strategies by highlighting trends, strengths, and weaknesses across different departments. In design, they blend high-level overviews with more granular data points. When relevant, data can be segregated by departments or teams, enhancing clarity. Recognizing and showcasing emerging trends that might inform tactical strategies is a critical design consideration. Encouraging collaborative decision-making, these dashboards might incorporate features allowing annotations, comments, or shared views.
Dashboards and Their Key Design Principles
| Dashboard Type | Key Design Principles |
|---|---|
| Strategic Dashboards | - High-Level Overview: Broad view, highlighting trends - Lesser Granularity: Avoid excessive detail; focus on trends - Visually Rich: Use graphs and charts - Consistent Time Frames: e.g., quarterly, annually |
| Operational Dashboards | - Real-time Updates - Clear Alerts & Indicators - Accessible & Mobile-friendly - Actionable Data Points |
| Analytical Dashboards | - Deep Dive Capabilities: Filters, drill-downs, etc. - Data Integrity - Visualization Variety: e.g., heat maps, scatter plots - Historical Context |
| Platform-specific Dashboards | - Platform Relevant Metrics: e.g., engagement rates for social media - Integration Capabilities - Benchmarking: Against industry or competitors - Action Triggers: e.g., content recommendations |
| Tactical Dashboards | - Balanced View: High-level overviews and detailed data - Departmental Segregation - Trend Highlighting - Collaborative Features: Annotations, comments, shared views |
Proper design ensures effective and insightful data presentations for each dashboard type.