7 Data Visualization
PRELIMINARY AND INCOMPLETE
In the realm of Business Intelligence (BI), the ability to transform raw data into meaningful insights is paramount. This chapter delves into the foundational aspects of Data Description and Visualization, two critical components that enable businesses to make informed decisions. We start by understanding data in its various forms and then explore how visualization serves as a bridge between complex data structures and actionable business insights (Few, 2009; Tufte, 2001).
Data Description involves the initial examination and categorization of raw data, preparing it for further analysis. This process is crucial for identifying the types of data at hand, whether qualitative or quantitative, and understanding its potential implications for business strategies (Heer & Shneiderman, 2012). Visualization, on the other hand, employs graphical representations to make the abstract and often intricate data more comprehensible and accessible to business stakeholders (Yau, 2011; Cairo, 2012). Through charts, graphs, and other visual aids, complex information is distilled into a format that facilitates quicker and more effective decision-making processes.
Together, Data Description and Visualization form the backbone of BI, transforming raw datasets into a narrative that can guide business actions and strategies. This chapter aims to elucidate these concepts further, providing a solid foundation for leveraging BI to its fullest potential in driving business success.
7.1 Chapter Goals
Upon concluding this chapter, readers will have the acumen to:
- Understand the foundational aspects of data description and visualization in Business Intelligence (BI).
- Explore the pivotal role of data visualization in transforming raw data into actionable insights.
- Illustrate various types of data relationships through visualization examples using ggplot2.
- Emphasize the importance of storytelling in data visualization and its impact on decision-making.
- Highlight the principles of good design in data visualization, focusing on minimizing the ink-to-information ratio.
7.2 The Central Role of Data Visualization
Data visualization plays a pivotal role in BI, transforming the intricate and often voluminous world of raw data into clear, actionable narratives that influence decision-making. Its primary function is to simplify complex datasets, rendering them accessible and understandable, thereby enabling quick and informed decisions. Visual representations such as charts and graphs highlight trends, anomalies, and patterns, allowing businesses to swiftly identify areas that are performing well or need attention. Furthermore, data visualization makes data more approachable for a wider audience within the organization, promoting a culture that values and utilizes data-driven insights for strategic planning.
7.2.1 Exploring vs. Explaining: Visualization Techniques
The distinction between exploratory and explanatory visualization is key to leveraging data visualization effectively in BI. Exploratory visualization is designed for data professionals who delve into datasets to discover underlying patterns, anomalies, or insights. This approach is characterized by interactive and iterative visualizations that encourage users to manipulate data and explore its various dimensions, leading to the formulation of new hypotheses or insights that inform further analysis and strategic decisions.
Conversely, explanatory visualization targets a wider audience, including stakeholders and decision-makers, aiming to communicate specific findings or insights drawn from the data. These visualizations focus on delivering a clear and impactful message, emphasizing simplicity and clarity to guide strategic decisions and actions within the business.
7.2.2 Revealing Data Relationships through Visualization
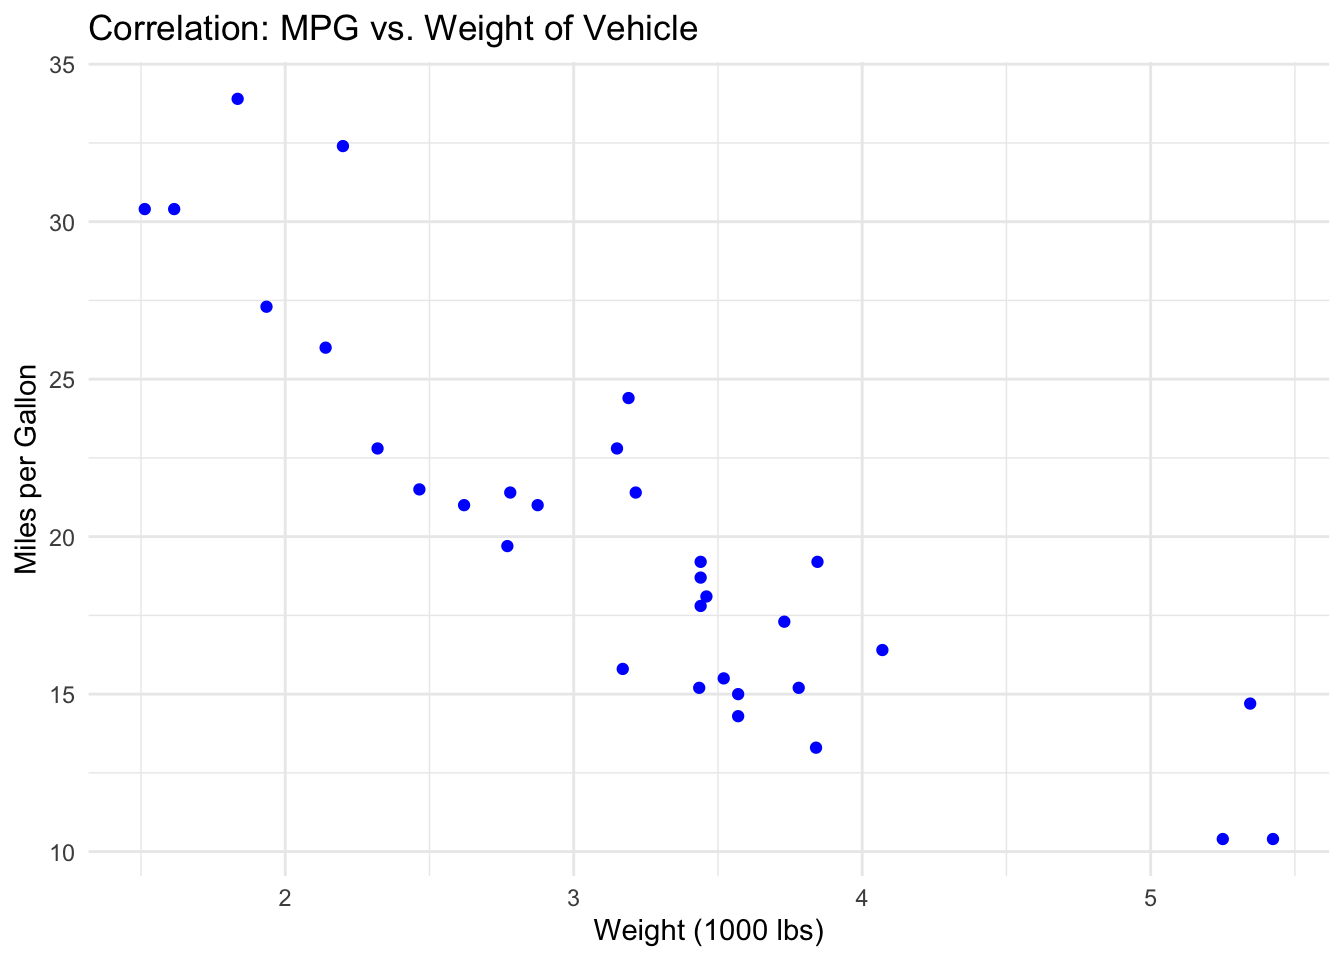
In the realm of data visualization, understanding various types of relationships within datasets is crucial for extracting meaningful insights. The concept of correlation focuses on the linear association between two variables, assessing whether variations in one are systematically associated with changes in the other, delineating scenarios of positive, negative, or no correlation (Heer & Shneiderman, 2012). This analysis is fundamental in identifying potential causal relationships or dependencies.
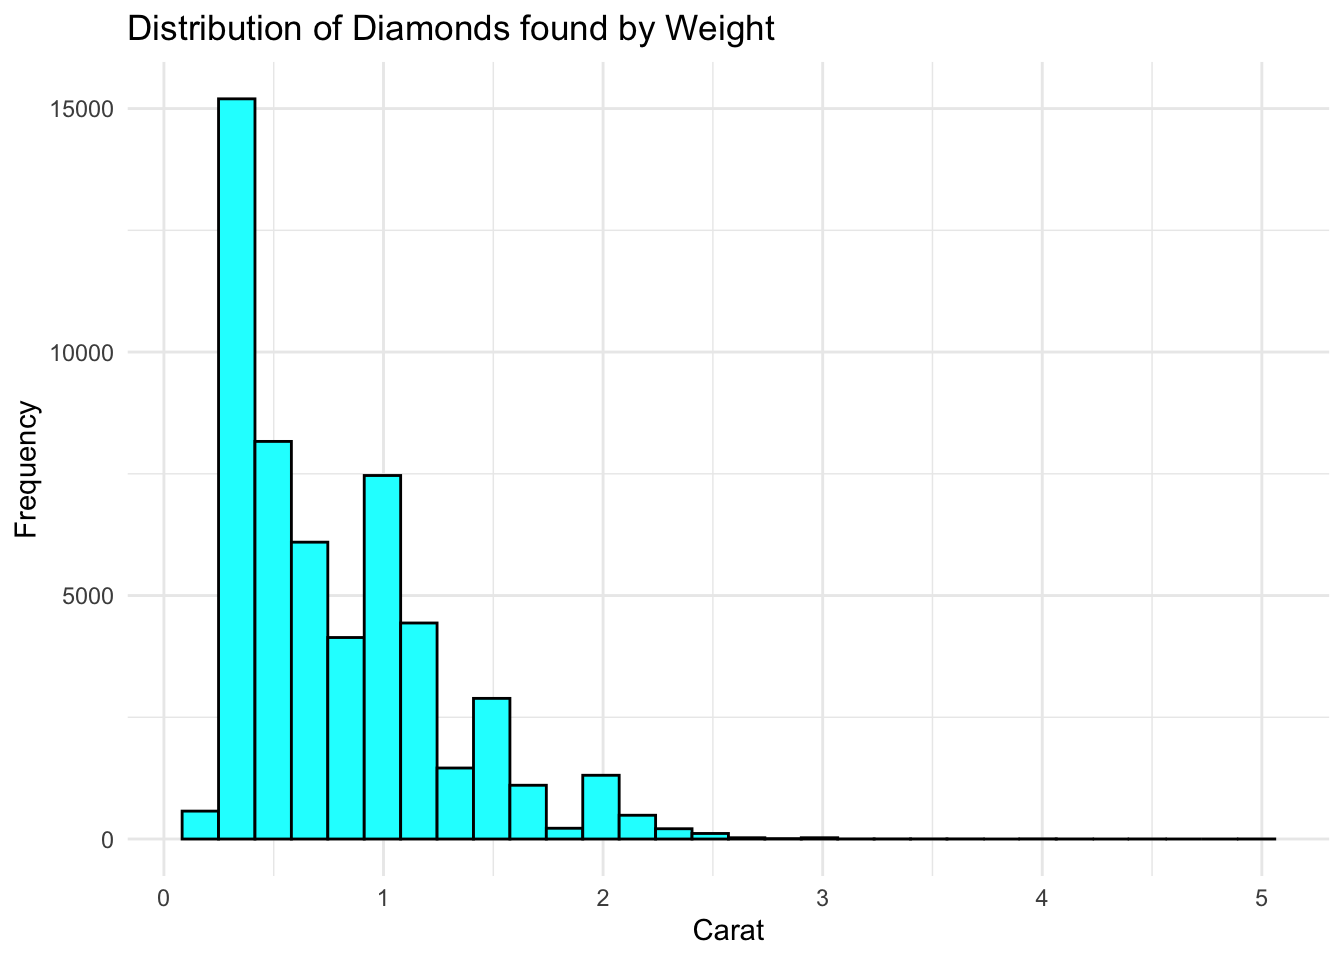
The examination of distribution centers on the spread of data points across a range of values, aiming to uncover the underlying structure of the data. This involves analyzing central tendency, variability, and the shape of the distribution, such as normal or skewed distributions (Tufte, 2001). Understanding the distribution is vital for grasping the characteristics and potential biases of a dataset, which is foundational for statistical analysis and predictive modeling.
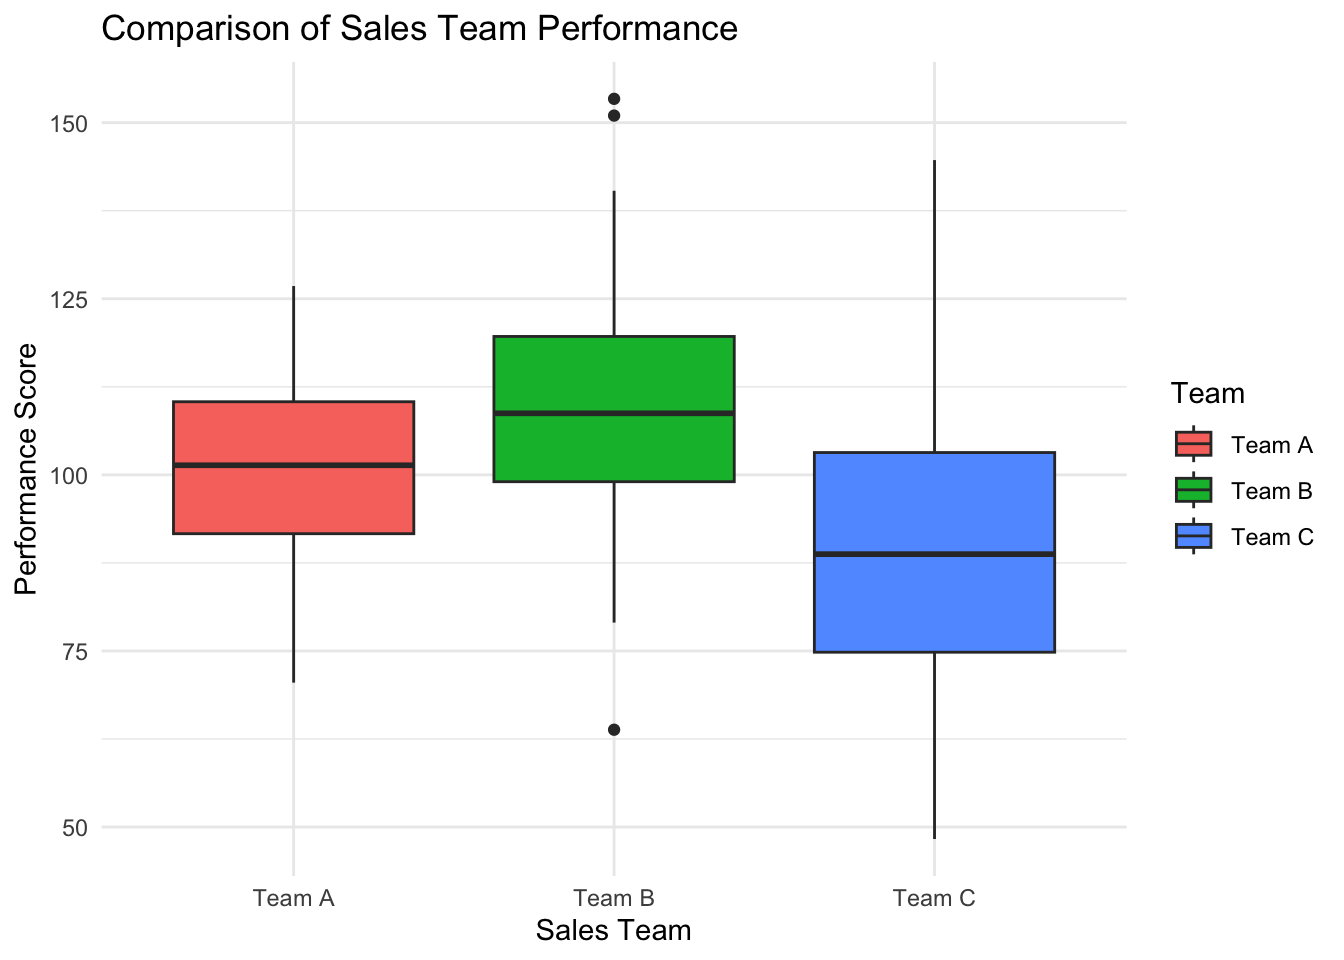
Comparative analysis in data visualization is used to highlight differences and similarities within datasets or among different segments of a dataset. This approach is crucial for observing patterns, trends, and anomalies over time or across categories, facilitating a deeper understanding of the dataset’s dynamics and informing decision-making processes (Yau, 2011).
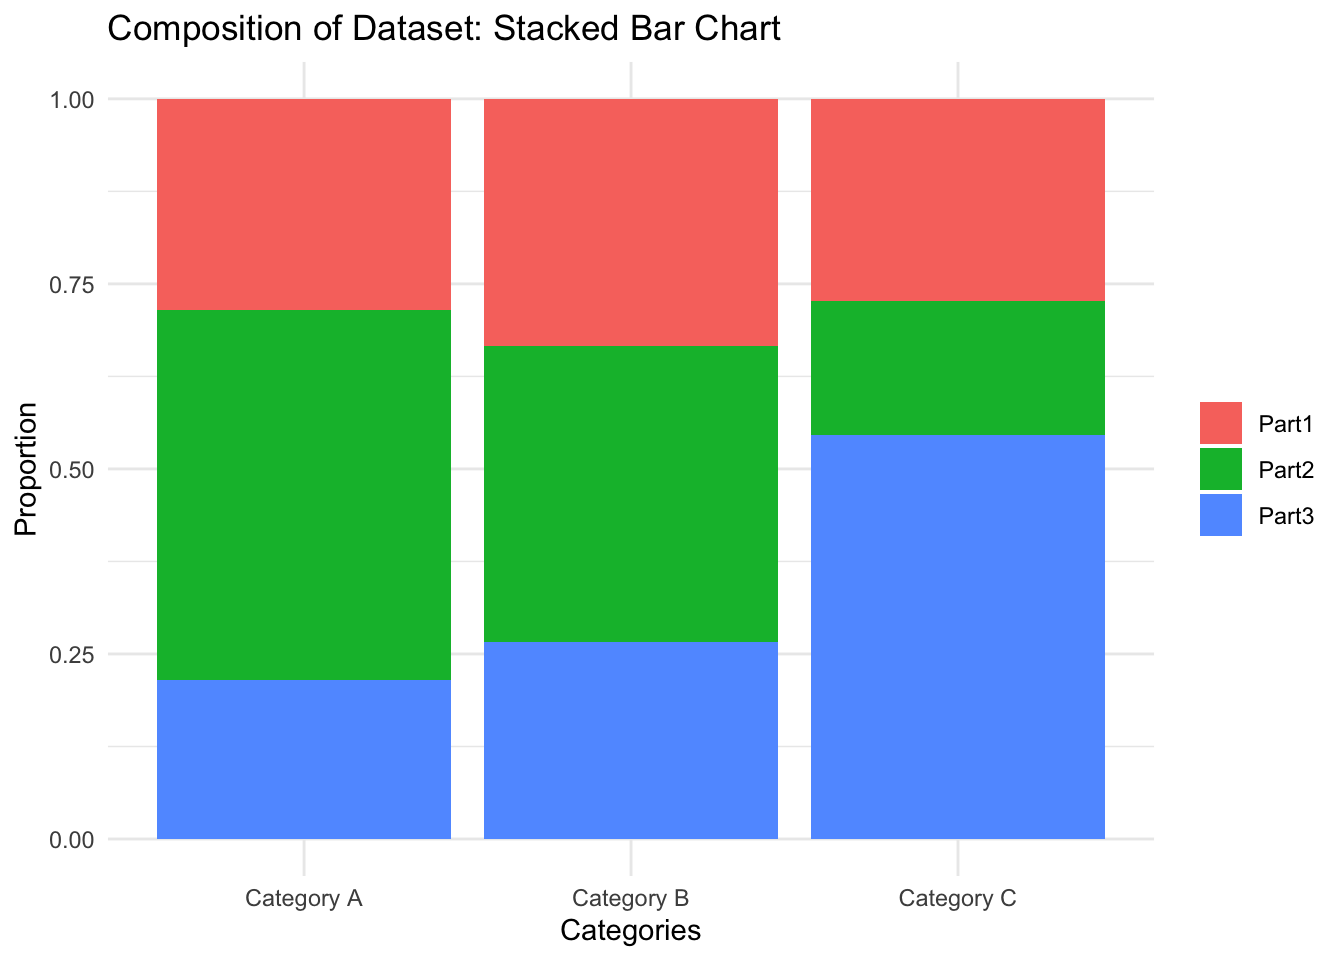
Composition relationships focus on how individual parts contribute to a whole, providing insights into the proportional makeup of a dataset. This perspective is invaluable for understanding the relative importance of different components and offers a clear picture of how individual elements combine to form the aggregate (Cairo, 2012).
“Complex Relationships” extend beyond simple correlations or distributions to explore the multifaceted interdependencies among multiple variables within a dataset. This approach is dedicated to unveiling the intricate network of connections and interactions that define the dynamics of data. By investigating Complex Relationships, analysts can appreciate the sophisticated interplay of elements and discover hidden patterns and insights that may not be evident through more basic analyses (Few, 2009). This perspective is essential for comprehending the elaborate structure of data and for unlocking deeper, more comprehensive understandings that guide informed decision-making.
7.3 Storytelling with Data and Visualization
7.3.1 Starting with the Right Question
The journey of storytelling with data begins long before the first chart is created or the first line of the narrative is written; it starts with the formulation of a compelling question. This foundational step is crucial because the question shapes the direction of the analysis, determines the data that needs to be collected, and ultimately guides the narrative that will be constructed. A well-articulated question acts as a beacon, keeping the subsequent data exploration and storytelling efforts aligned with the overarching goal. Whether the aim is to improve customer satisfaction, optimize operational efficiency, or explore new market opportunities, starting with a clear, relevant question ensures that the data storytelling efforts are purposeful and impactful.
7.3.2 The Importance of Engagement and Memorability
The heart of storytelling with data lies in its capacity to engage. Unlike raw data or dry analysis, a story, with its beginning, middle, and end, captures the audience’s attention and holds it. By framing data within a narrative context, we transform abstract figures into relatable, engaging insights. This engagement is not just about capturing interest; it’s about making the data resonate on a personal level with the audience, thereby enhancing the impact of the information conveyed.
Beyond engagement, the power of storytelling is in its memorability. Humans are wired to remember stories far better than isolated facts. By embedding key data points within a narrative, we make them more memorable, ensuring that the core insights have a lasting impact on the audience. This aspect of storytelling is particularly valuable in business contexts, where decisions often need to be recalled and acted upon long after the presentation has concluded.
7.3.3 Simplification Through Narrative
A well-crafted story serves as a powerful tool for simplifying complex information. In the business world, where decisions often hinge on the interpretation of complex datasets, the ability to distill intricate data into a clear and compelling narrative is invaluable. Storytelling helps bridge the gap between complex data analytics and actionable insights, making the information accessible to stakeholders at all levels of data literacy. This simplification is not about dumbing down the data; rather, it’s about making it intelligible and relevant to the audience, thereby facilitating informed decision-making.
7.3.4 Visualization: The Visual Narrative
Visualization plays a pivotal role in data storytelling, providing the visual narrative that complements the verbal or written story. Effective visualizations do more than just represent data; they illuminate trends, highlight key points, and offer evidence to support the narrative. They serve as the plot points in the story of the data, guiding the audience through the narrative arc from introduction to conclusion.
- Highlighting Trends and Patterns: Visualizations bring to light the trends and patterns that are the essence of the story, making the narrative not just told, but seen.
- Drawing Attention to Key Insights: Through careful design, visualizations can emphasize the most critical parts of the data story, ensuring that key insights are noticed and understood.
- Facilitating Comprehension: Complex ideas can be conveyed more easily through visuals, helping the audience grasp sophisticated concepts and relationships within the data.
- Lending Credibility: Visual evidence bolsters the narrative, providing tangible proof that reinforces the story’s messages and conclusions.
7.3.5 Weaving the Narrative
The final step in storytelling with data and visualization is the weaving of the narrative. This involves integrating the data, insights, and visualizations into a coherent story that flows logically and compellingly. The narrative should guide the audience through the exploration of the data, the discovery of insights, and the conclusions drawn, all while keeping the initial question in mind. This cohesive narrative ensures that the story not only informs but also inspires action, leading to meaningful outcomes and decisions.
7.4 Tailoring Visualization to the Question and Relationship Type
The art of data visualization is not merely in its execution but in the thoughtful selection of the right visual tool that aligns with the underlying question and the type of relationship you aim to explore within your data. This strategic choice is pivotal in illuminating insights and guiding informed decisions.
7.4.1 Aligning with the Question
The initial step in selecting a data visualization begins with a clear understanding of the question at hand. This question acts as a compass, directing the analytical journey and, by extension, the choice of visualization. For instance, if the question revolves around understanding the performance trend over time, a line graph might be the most appropriate choice, providing a clear view of upward or downward trajectories. Conversely, if the question is about comparing sales across different regions, a bar chart could more effectively highlight regional disparities. The question not only sets the stage but also ensures that the visualization serves a purpose, whether it’s to compare, to show distribution, to reveal relationships, or to illustrate composition.
7.4.2 Considering Relationship Types
Once the question is clear, the next step involves considering the type of relationship present in the data that you wish to elucidate. Different visual tools excel in showcasing various relationship types:
- Correlation: When the question concerns the relationship between two variables, such as the link between marketing spend and sales growth, scatter plots become invaluable. They provide a visual correlation, showcasing whether variables move in sync, in opposition, or without any clear pattern.
- Distribution: Questions about the overall characteristics of a dataset, such as its variability or central tendency, call for histograms or box plots. These visualizations break down the distribution, offering insights into the dataset’s spread and central tendencies, which are essential for understanding its underlying structure.
- Comparison: When the question involves comparing elements, such as the performance of different sales teams or quarterly revenue over several years, bar charts and line graphs are apt choices. They lay out differences side by side, making disparities or trends readily apparent.
- Composition: If the question pertains to understanding how various parts make up a whole, such as the proportion of sales from different product lines or stacked bar charts provide a clear breakdown of each component’s contribution, offering a visual composition of the data.
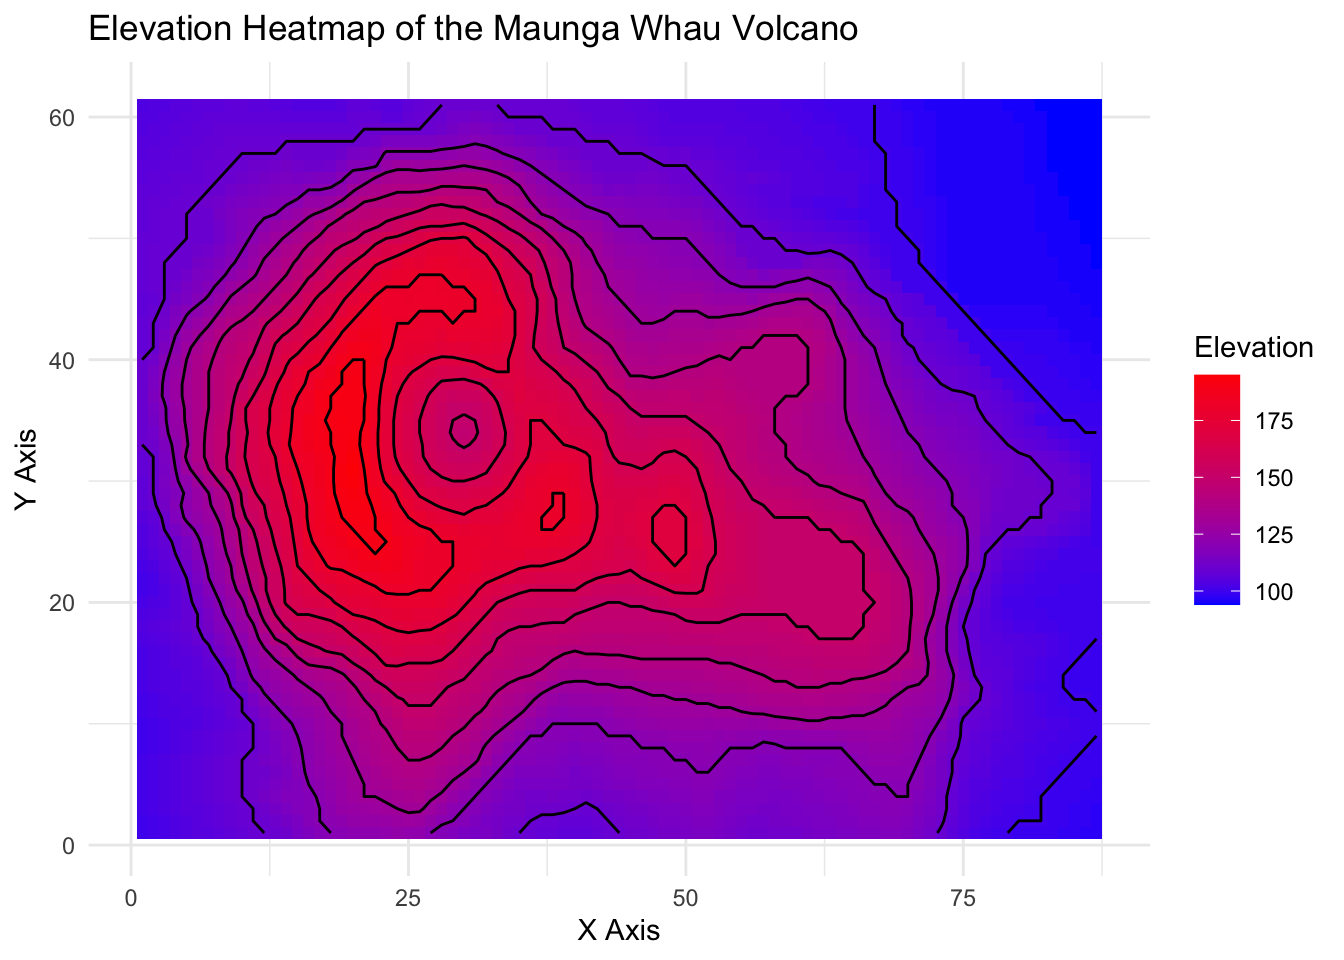
- Complex Relationship: For more complex questions that delve into the interactions among various data elements, tools like multi-dimensional plots, heat maps, and network diagrams come into play. They unravel the intricate web of relationships, offering a nuanced view of how elements within the dataset relate to one another.
7.5 Embracing Good Design Principles in Data Visualization
Effective data visualization transcends the mere representation of data; it encapsulates the art of communicating information clearly, accurately, and efficiently. Central to this art are several design principles that ensure visualizations not only capture attention but also convey the intended message without overwhelming or misleading the viewer. Among these principles, the concept of minimizing the ink-to-information ratio, popularized by Edward Tufte, stands out as a cornerstone of good design.
7.5.1 Minimizing the Ink-to-Information Ratio
The ink-to-information ratio is a concept that advocates for the use of minimal graphical elements to convey the maximum amount of information. The principle suggests that every unit of ink used on a graph should communicate new information; anything that does not serve this purpose—often referred to as “chart junk”—should be eliminated. Chart junk can include excessive decorative elements, such as heavy grid lines, unnecessary labels, or ornamental patterns that do not enhance understanding but rather distract from the core message.
7.5.2 Eliminating Chart Junk
Chart junk detracts from the clarity and effectiveness of data visualization by introducing noise that competes with the actual data for the viewer’s attention. To adhere to good design principles, it’s essential to:
Simplify the Visuals: Use clean and straightforward visual elements. Opt for clear, concise labels and remove any non-essential graphics or text.
Focus on Data: Ensure that the data stands out by minimizing the use of heavy or dark grid lines, backgrounds, and borders. The emphasis should always be on the data points or trends being presented.
Use Color Wisely: Color is a powerful tool in visualization, but it should be used sparingly and purposefully. Use color to highlight significant data points or trends and maintain consistency across similar elements.
Opt for Direct Labeling: Wherever possible, label data points directly rather than relying on a legend. This approach reduces the viewer’s need to cross-reference between the data and the legend, streamlining the communication process.
7.5.3 Enhancing Legibility and Accessibility
Good design also entails ensuring that visualizations are legible and accessible to all audience members, including those with visual impairments. This includes:
Contrast and Size: Use high-contrast color schemes and ensure text and graphical elements are of a size that’s easy to read.
Accessibility: Consider colorblind-friendly palettes and provide textual alternatives or descriptions where necessary to ensure inclusivity.
7.5.4 Balancing Aesthetics and Functionality
While aesthetics are important in making visualizations appealing, they should not overshadow the primary goal of data communication. A well-designed visualization strikes a balance, using aesthetic elements to enhance comprehension and engagement without compromising the integrity and accuracy of the data.
7.6 The Grammar of Graphics: A Framework for Data Visualization
The Grammar of Graphics is a conceptual framework that systematizes the creation and understanding of statistical graphics. This framework, developed by Leland Wilkinson, treats the construction of graphical displays of data as a coherent system governed by a set of principles and elements, akin to the rules of grammar in language. By decomposing graphics into fundamental components, the Grammar of Graphics provides a powerful, flexible approach to visualization that extends beyond specific types of charts or graphs to encompass a broad range of visual representations of data.
7.6.1 Fundamental Elements
At its core, the Grammar of Graphics identifies several key elements that constitute any statistical graphic:
Data: The starting point for any visualization, representing the quantitative and categorical information that one aims to explore or present.
Aesthetics (Aes): These are the visual properties of the objects in the graph, such as position (x, y coordinates), color, shape, and size, which are mapped to variables in the data.
Geometric Objects (Geoms): The visual elements that represent data points in the graphic, such as points, lines, bars, and more. Each geom encodes data using aesthetics.
Scales: Scales map the values of data variables to the aesthetic properties of geoms, such as mapping a quantitative variable to the x-axis or a categorical variable to different colors.
Statistical Transformations: These are operations applied to the data before it is visualized, such as summarizing, binning, or applying statistical models, which can then be represented graphically.
Coordinate Systems: The space in which the data is plotted, with Cartesian coordinates being the most common, but others like polar coordinates are also used for specific graph types.
Faceting: The technique of creating multiple small plots within a larger graphic to represent different subsets or slices of the data, allowing for comparisons across categories or levels.
Themes: The non-data ink in a plot, which includes all stylistic elements like the background, grid lines, and text styling, that contribute to the readability and aesthetics of the graphic but do not encode data directly.
7.6.2 Principles of Composition
The Grammar of Graphics also emphasizes the compositional nature of graphical creation, where complex visuals are built up through layers. Each layer can add or modify elements of the plot, allowing for incremental construction and fine-tuning of the visualization. This layering principle supports a high degree of customization and flexibility, enabling the creation of simple graphics to highly complex, multi-faceted visualizations.
7.6.3 Implications and Applications
The Grammar of Graphics has far-reaching implications for data visualization, providing a unified framework that applies across different tools and technologies. It has directly influenced the development of various software implementations, most notably the ggplot2 package in R, created by Hadley Wickham, which operationalizes the Grammar of Graphics principles into a practical, powerful tool for data analysis and visualization.
By adopting the Grammar of Graphics, practitioners can approach data visualization more systematically, ensuring that each element of a plot serves a clear purpose and contributes to the overall narrative. This framework encourages thoughtful, intentional design choices that enhance the clarity, accuracy, and interpretability of statistical graphics.
ggplot2 is a data visualization package in R that implements the concepts of the Grammar of Graphics. Developed by Hadley Wickham, it’s part of the broader tidyverse ecosystem, a collection of R packages designed for data science that share an underlying design philosophy, grammar, and data structures. ggplot2 is renowned for its ability to create complex, multi-layered graphics through a coherent and intuitive syntax, making it a staple tool for data analysts and researchers.
To illustrate the use of ggplot2 with a built-in dataset, we’ll use mtcars, a dataset that comes with R and contains various attributes of 32 automobiles.
7.6.4 Step-by-Step Examples Using ggplot2
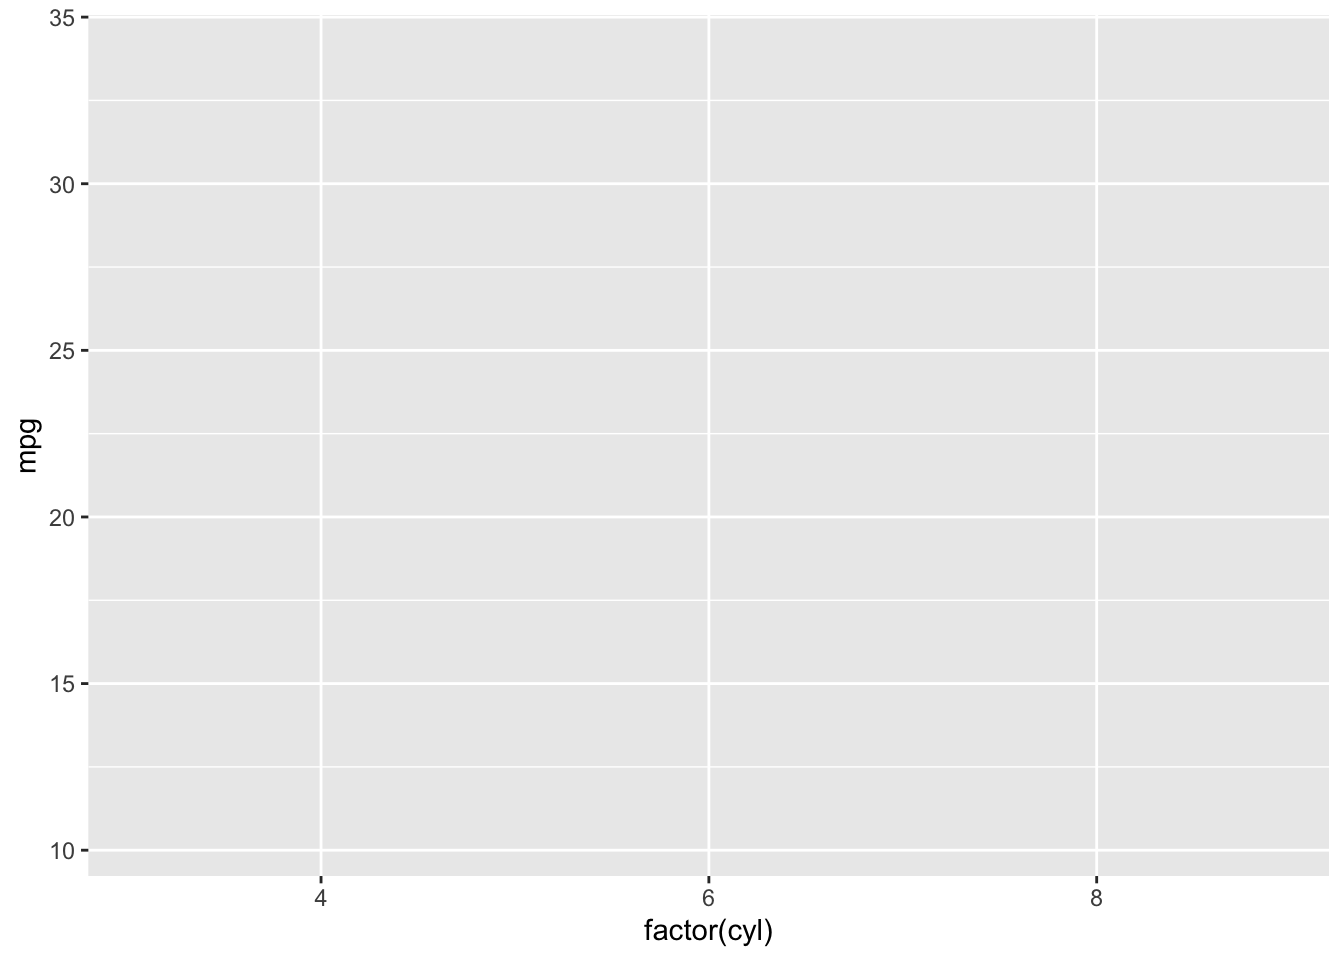
- Data and Aesthetic Mappings
First, load the ggplot2 package and set the dataset and aesthetic mappings. Here, we map mpg (miles per gallon) to the y-axis and cyl (number of cylinders) as a factor to the x-axis.
- Geometric Objects (Geoms)
Add a geometric object to visualize the data. For comparison across groups, a boxplot is a good choice.
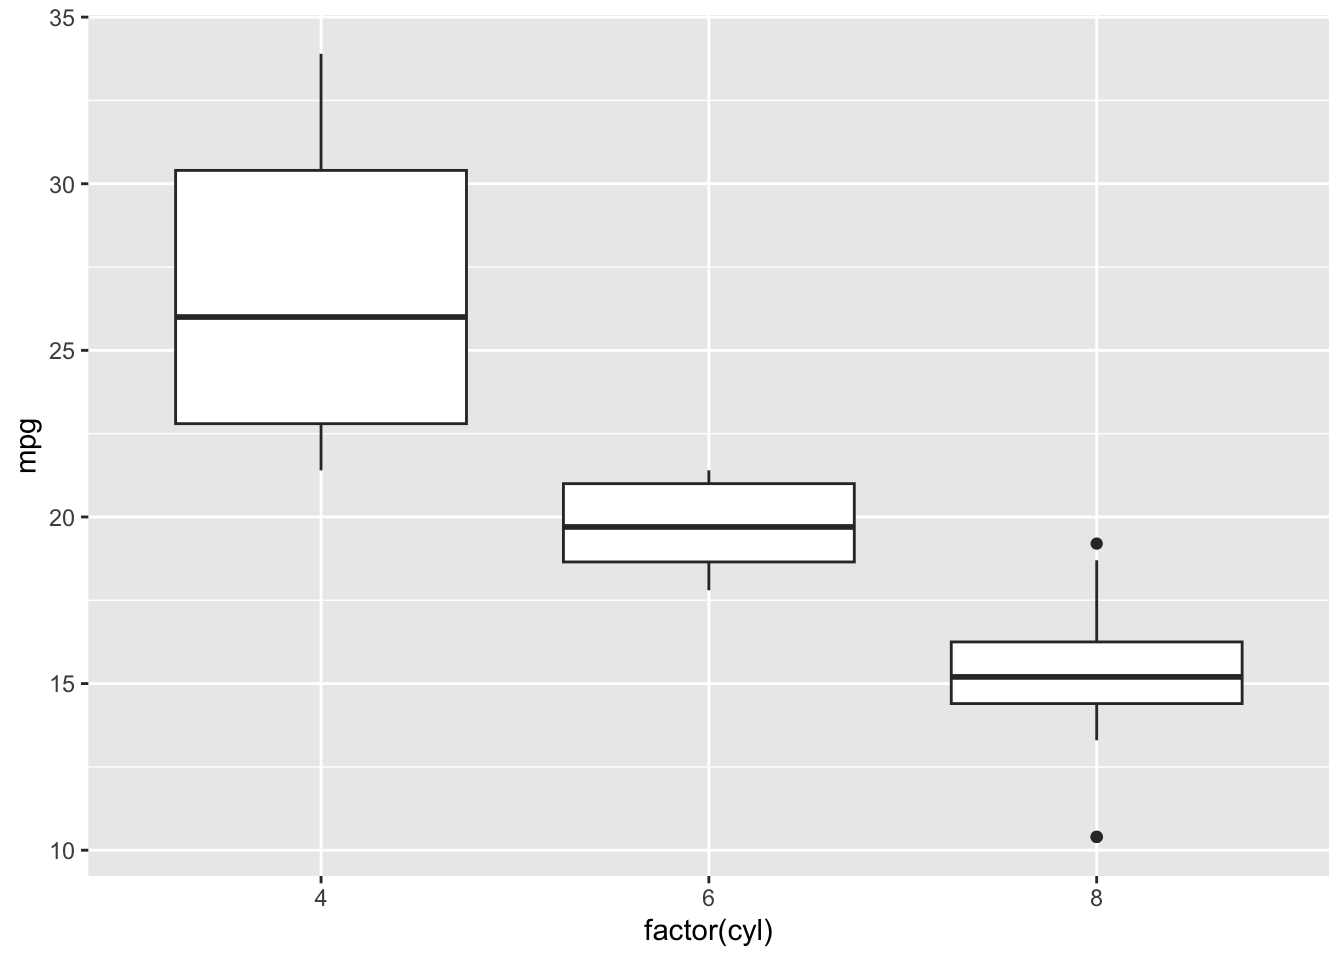
- Statistical Transformations
geom_boxplot() inherently uses statistical transformations to summarize the data. No additional code is needed for this basic boxplot example.
- Customize Scales
Customize scales to enhance the plot. For example, we can adjust the fill color based on the number of cylinders and change the y-axis to a log scale to better visualize data with a wide range:
ggplot(mtcars, aes(x = factor(cyl), y = mpg, fill = factor(cyl))) +
  geom_boxplot() +
  scale_fill_brewer(palette = "Pastel1") +
  scale_y_log10() +
  theme_gray()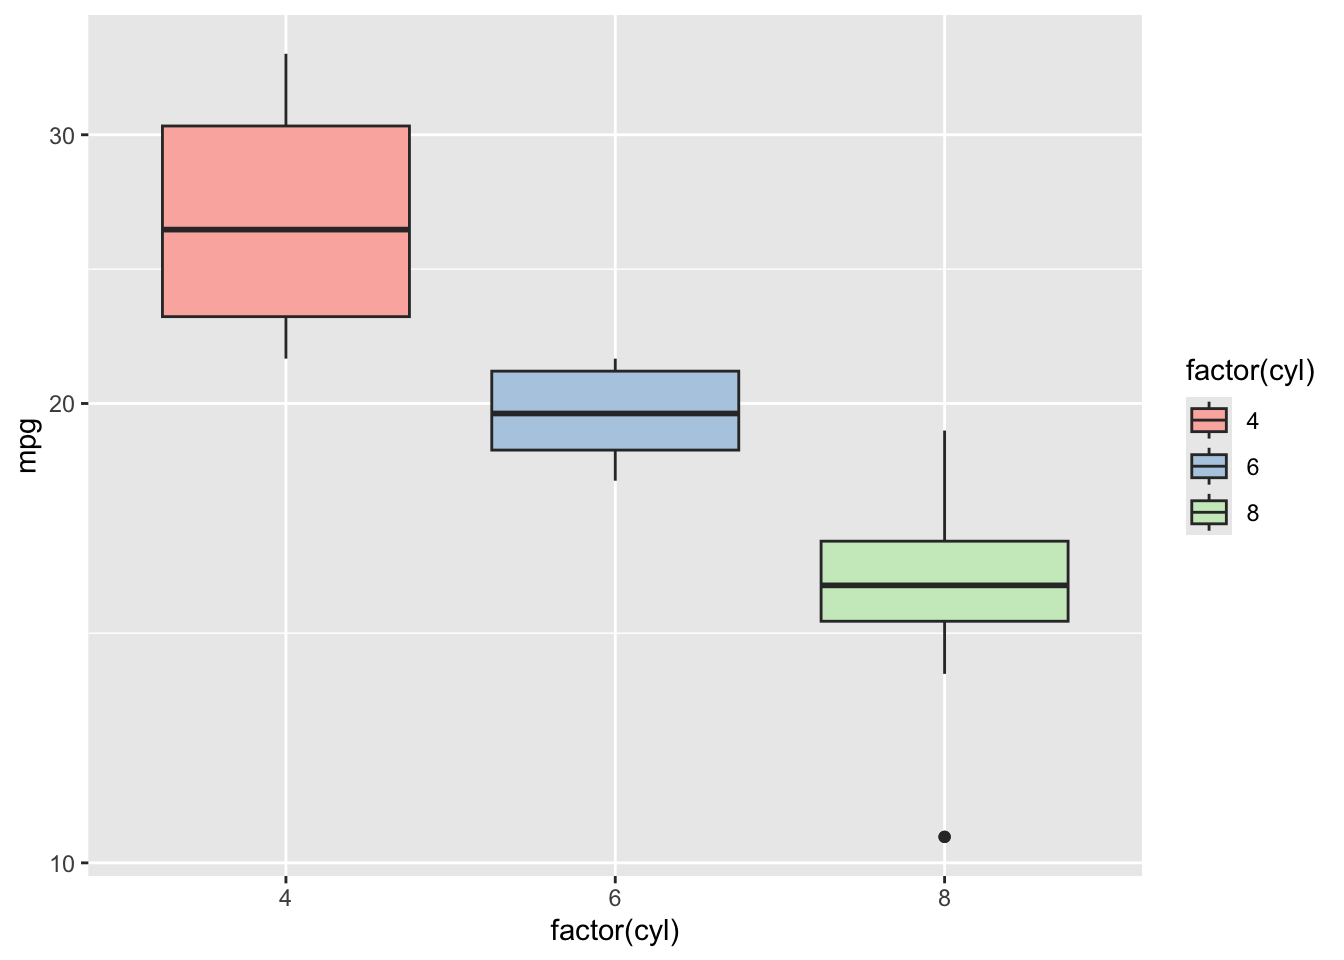
In this example, scale_fill_brewer(palette = "Pastel1") changes the fill color of the boxplots according to the cyl factor, using a soft, pastel palette for aesthetic variety. scale_y_log10() transforms the y-axis into a logarithmic scale, which can be particularly useful when dealing with skewed distributions or wide-ranging data, making the differences in mpg across cylinder counts more discernible.
- Coordinate Systems
The default Cartesian coordinates are typically used for boxplots, but ggplot2 allows for adjustments, such as flipping axes:
ggplot(mtcars, aes(x = factor(cyl), y = mpg, fill = factor(cyl))) +
  geom_boxplot() +
  coord_flip() +
  theme_gray()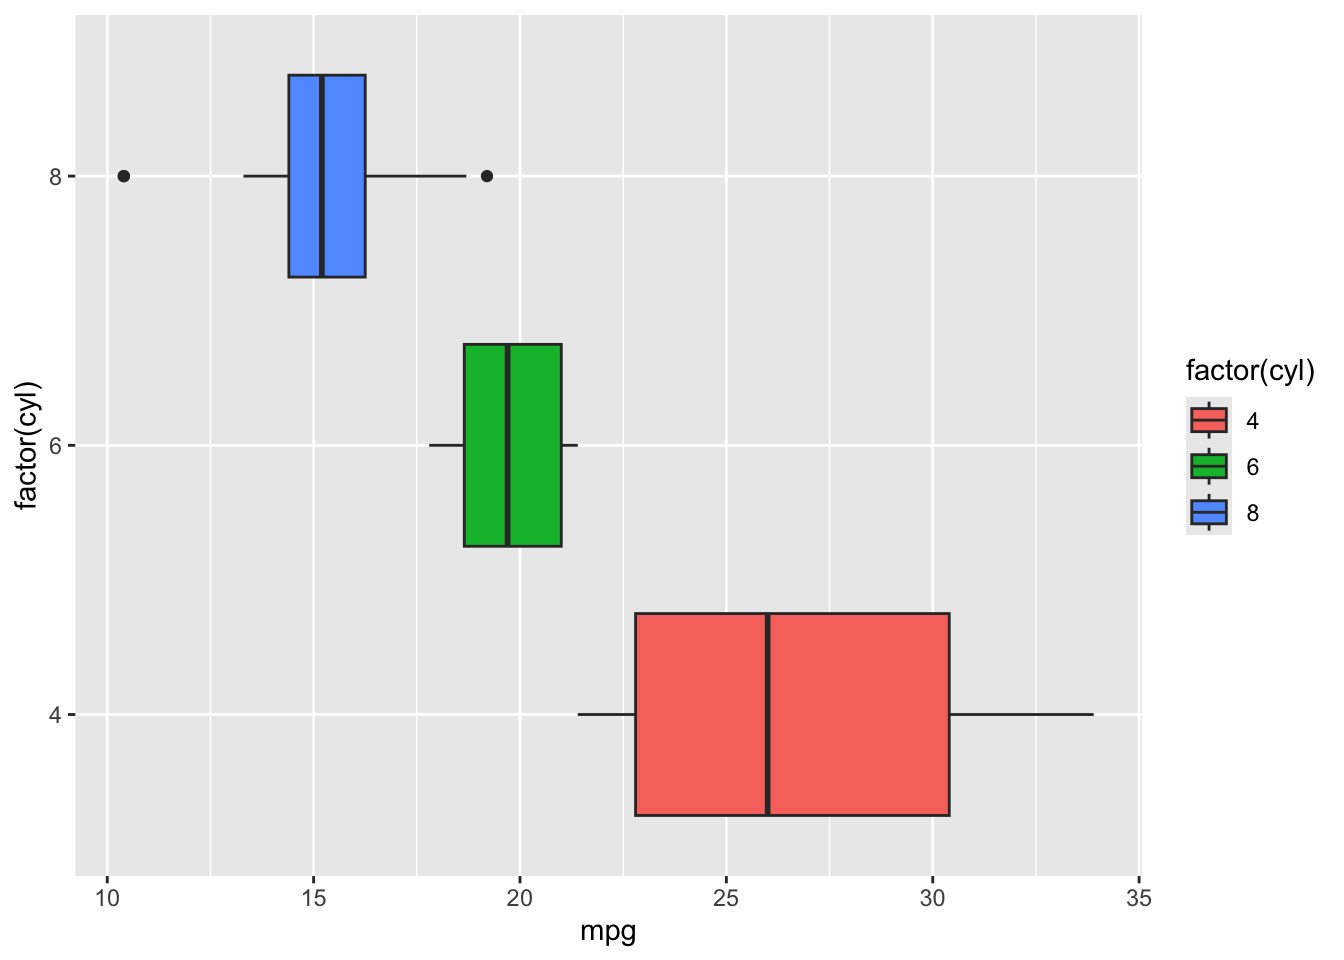
- Faceting
Create separate plots for each number of gears (gear) in the cars using faceting:
ggplot(mtcars, aes(x = factor(cyl), y = mpg, fill = factor(cyl))) +
  geom_boxplot() +
  facet_wrap(~gear) +
  theme_gray()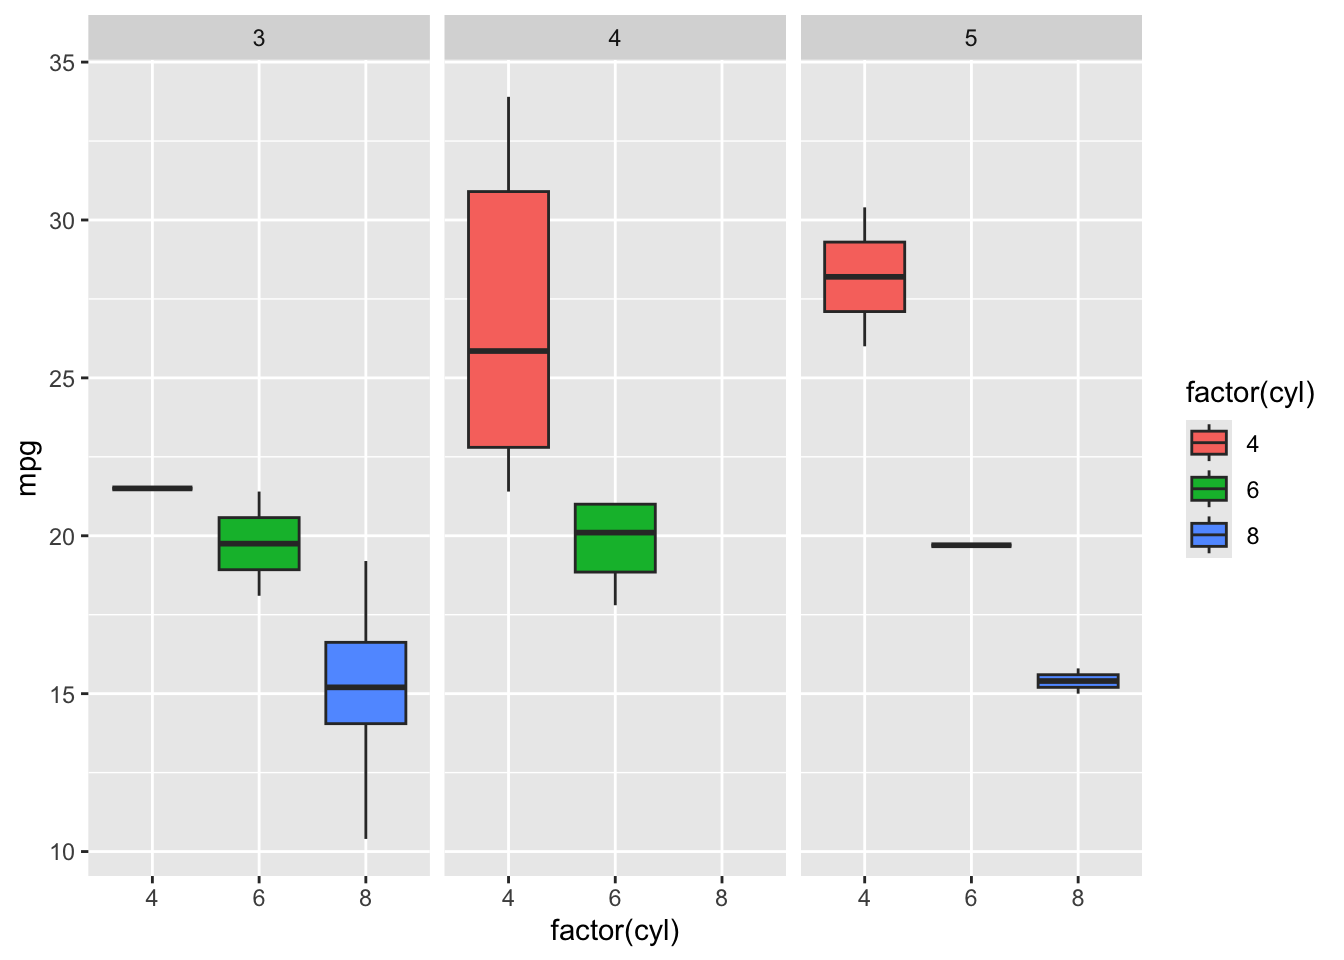
- Themes
Finally, customize the appearance with a theme:
ggplot(mtcars, aes(x = factor(cyl), y = mpg, fill = factor(cyl))) +
  geom_boxplot() +
  theme_minimal()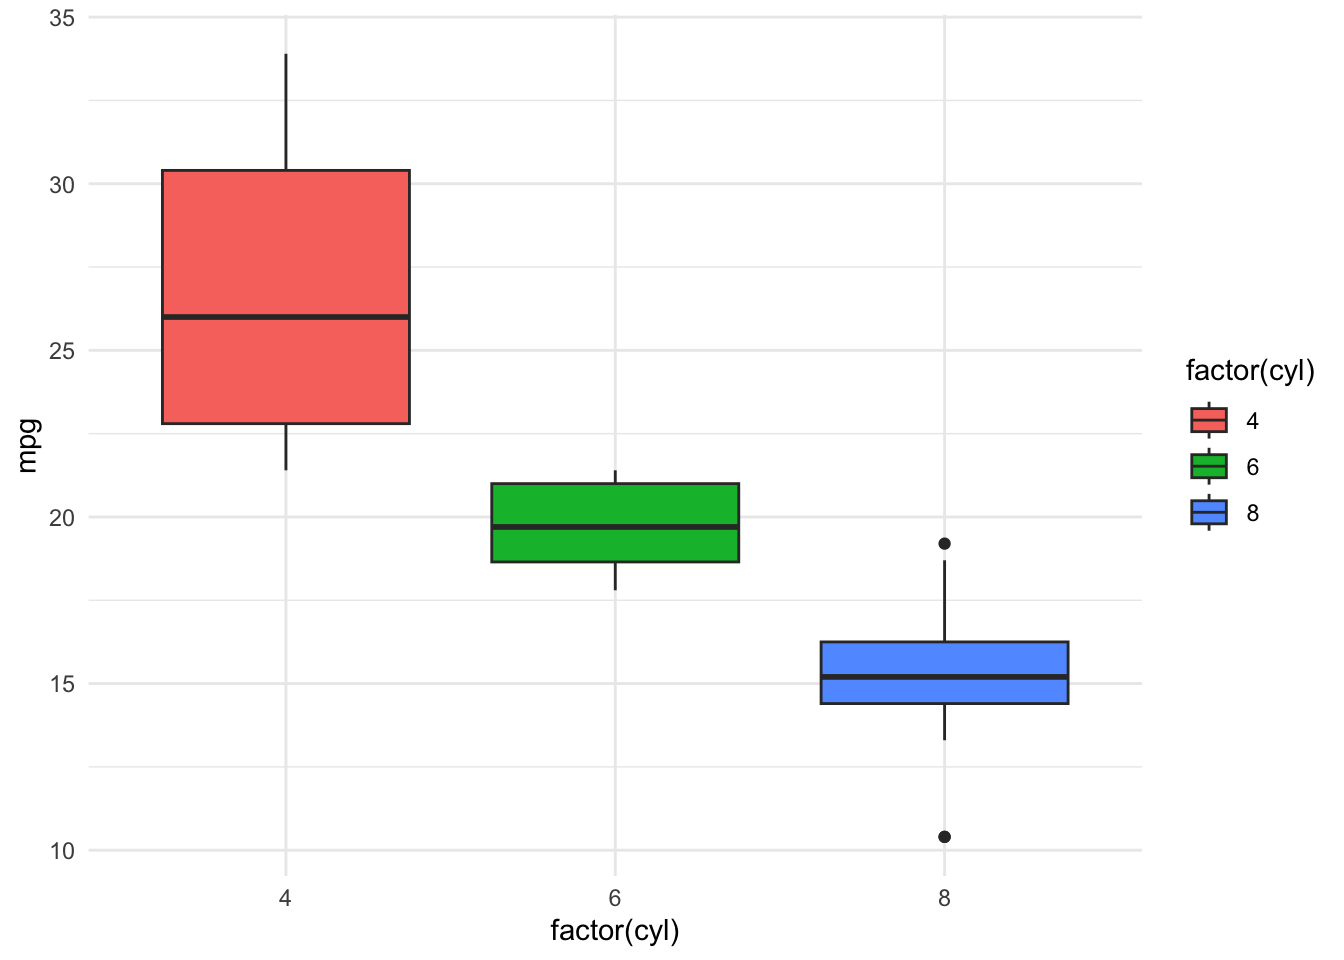
Using ggplot2 and following the Grammar of Graphics, we’ve incrementally built a boxplot visualization of the mtcars dataset, exploring the relationship between the number of cylinders in a car and its fuel efficiency. This step-by-step approach, from setting data and aesthetics to customizing themes, demonstrates the flexibility and power of ggplot2 in crafting insightful data visualizations.
7.7 Citations
Heer, J., & Shneiderman, B. (2012). Interactive Dynamics for Visual Analysis. ACM Queue, 10(2).
Tufte, E. R. (2001). The Visual Display of Quantitative Information. Graphics Press.
Yau, N. (2011). Visualize This: The FlowingData Guide to Design, Visualization, and Statistics. Wiley.
Few, S. (2009). Now You See It: Simple Visualization Techniques for Quantitative Analysis. Analytics Press.
Cairo, A. (2012). The Functional Art: An Introduction to Information Graphics and Visualization. New Riders.
Cairo, A. (2013). The Functional Art: An Introduction to Information Graphics and Visualization.
Yau, N. (2011). Visualize This: The FlowingData Guide to Design, Visualization, and Statistics.
Tufte, E. R. (2001). The Visual Display of Quantitative Information.
Few, S. (2009). Now You See It: Simple Visualization Techniques for Quantitative Analysis.
Murray, S. (2013). Interactive Data Visualization for the Web.